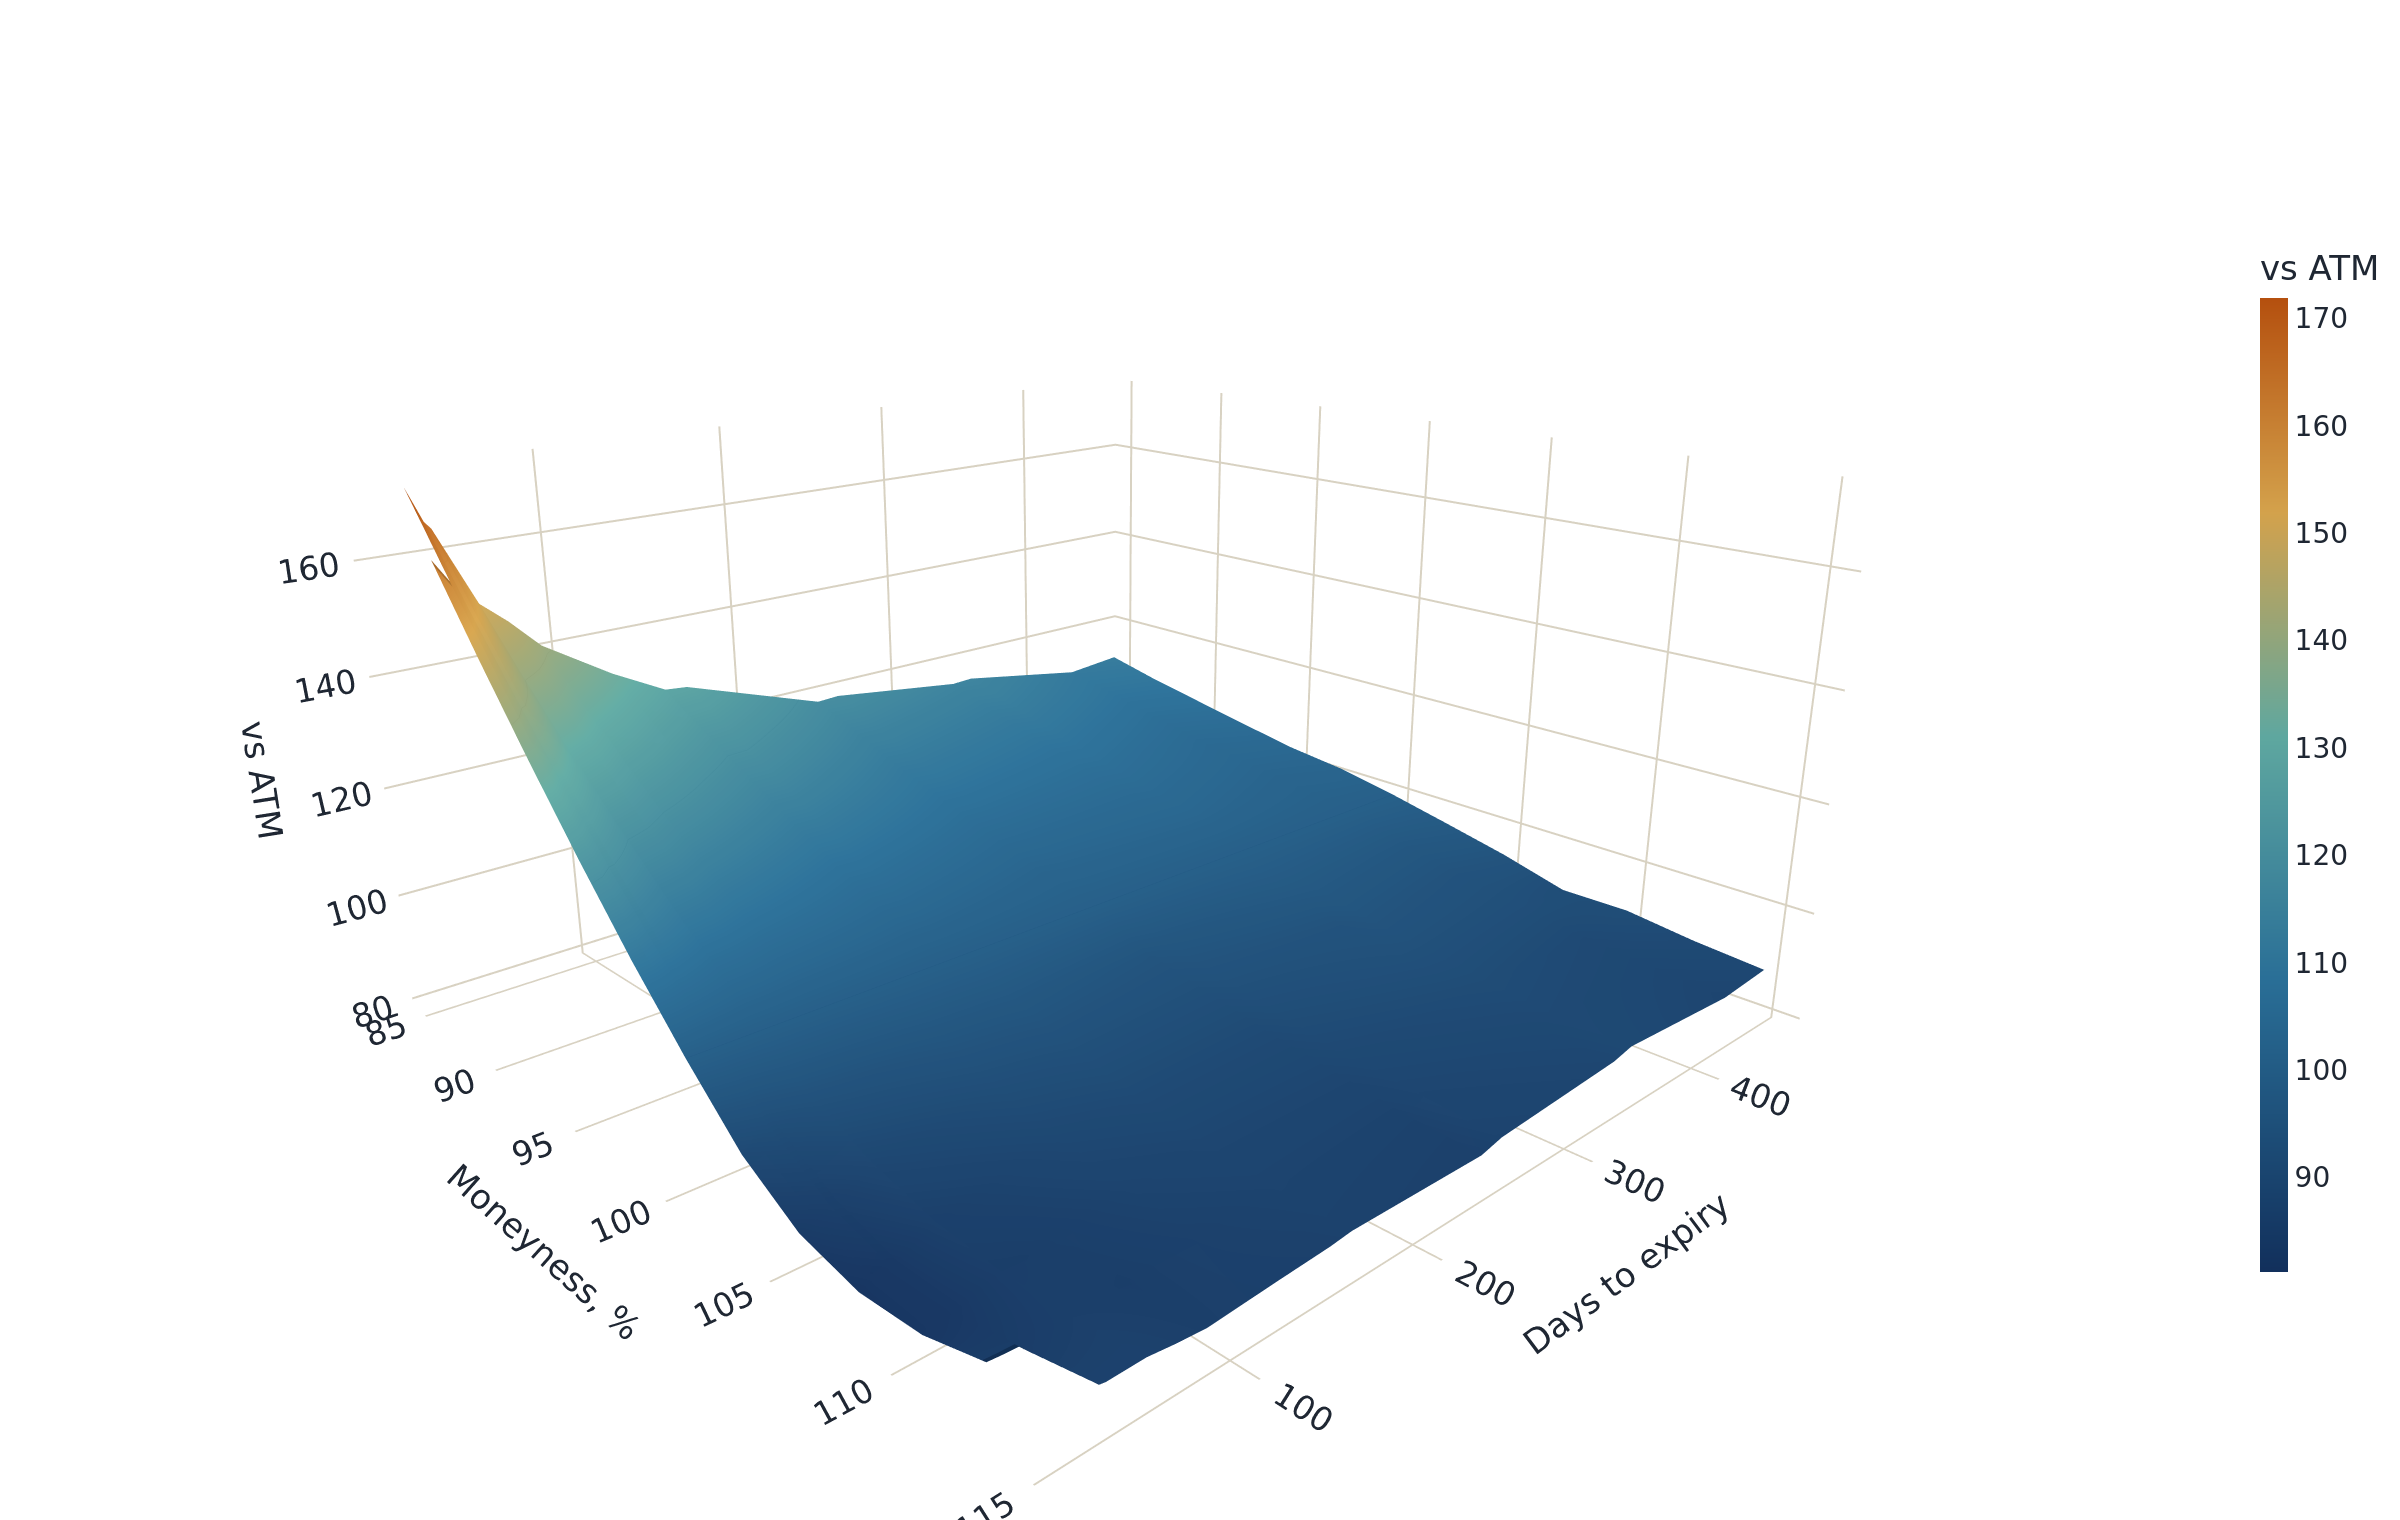
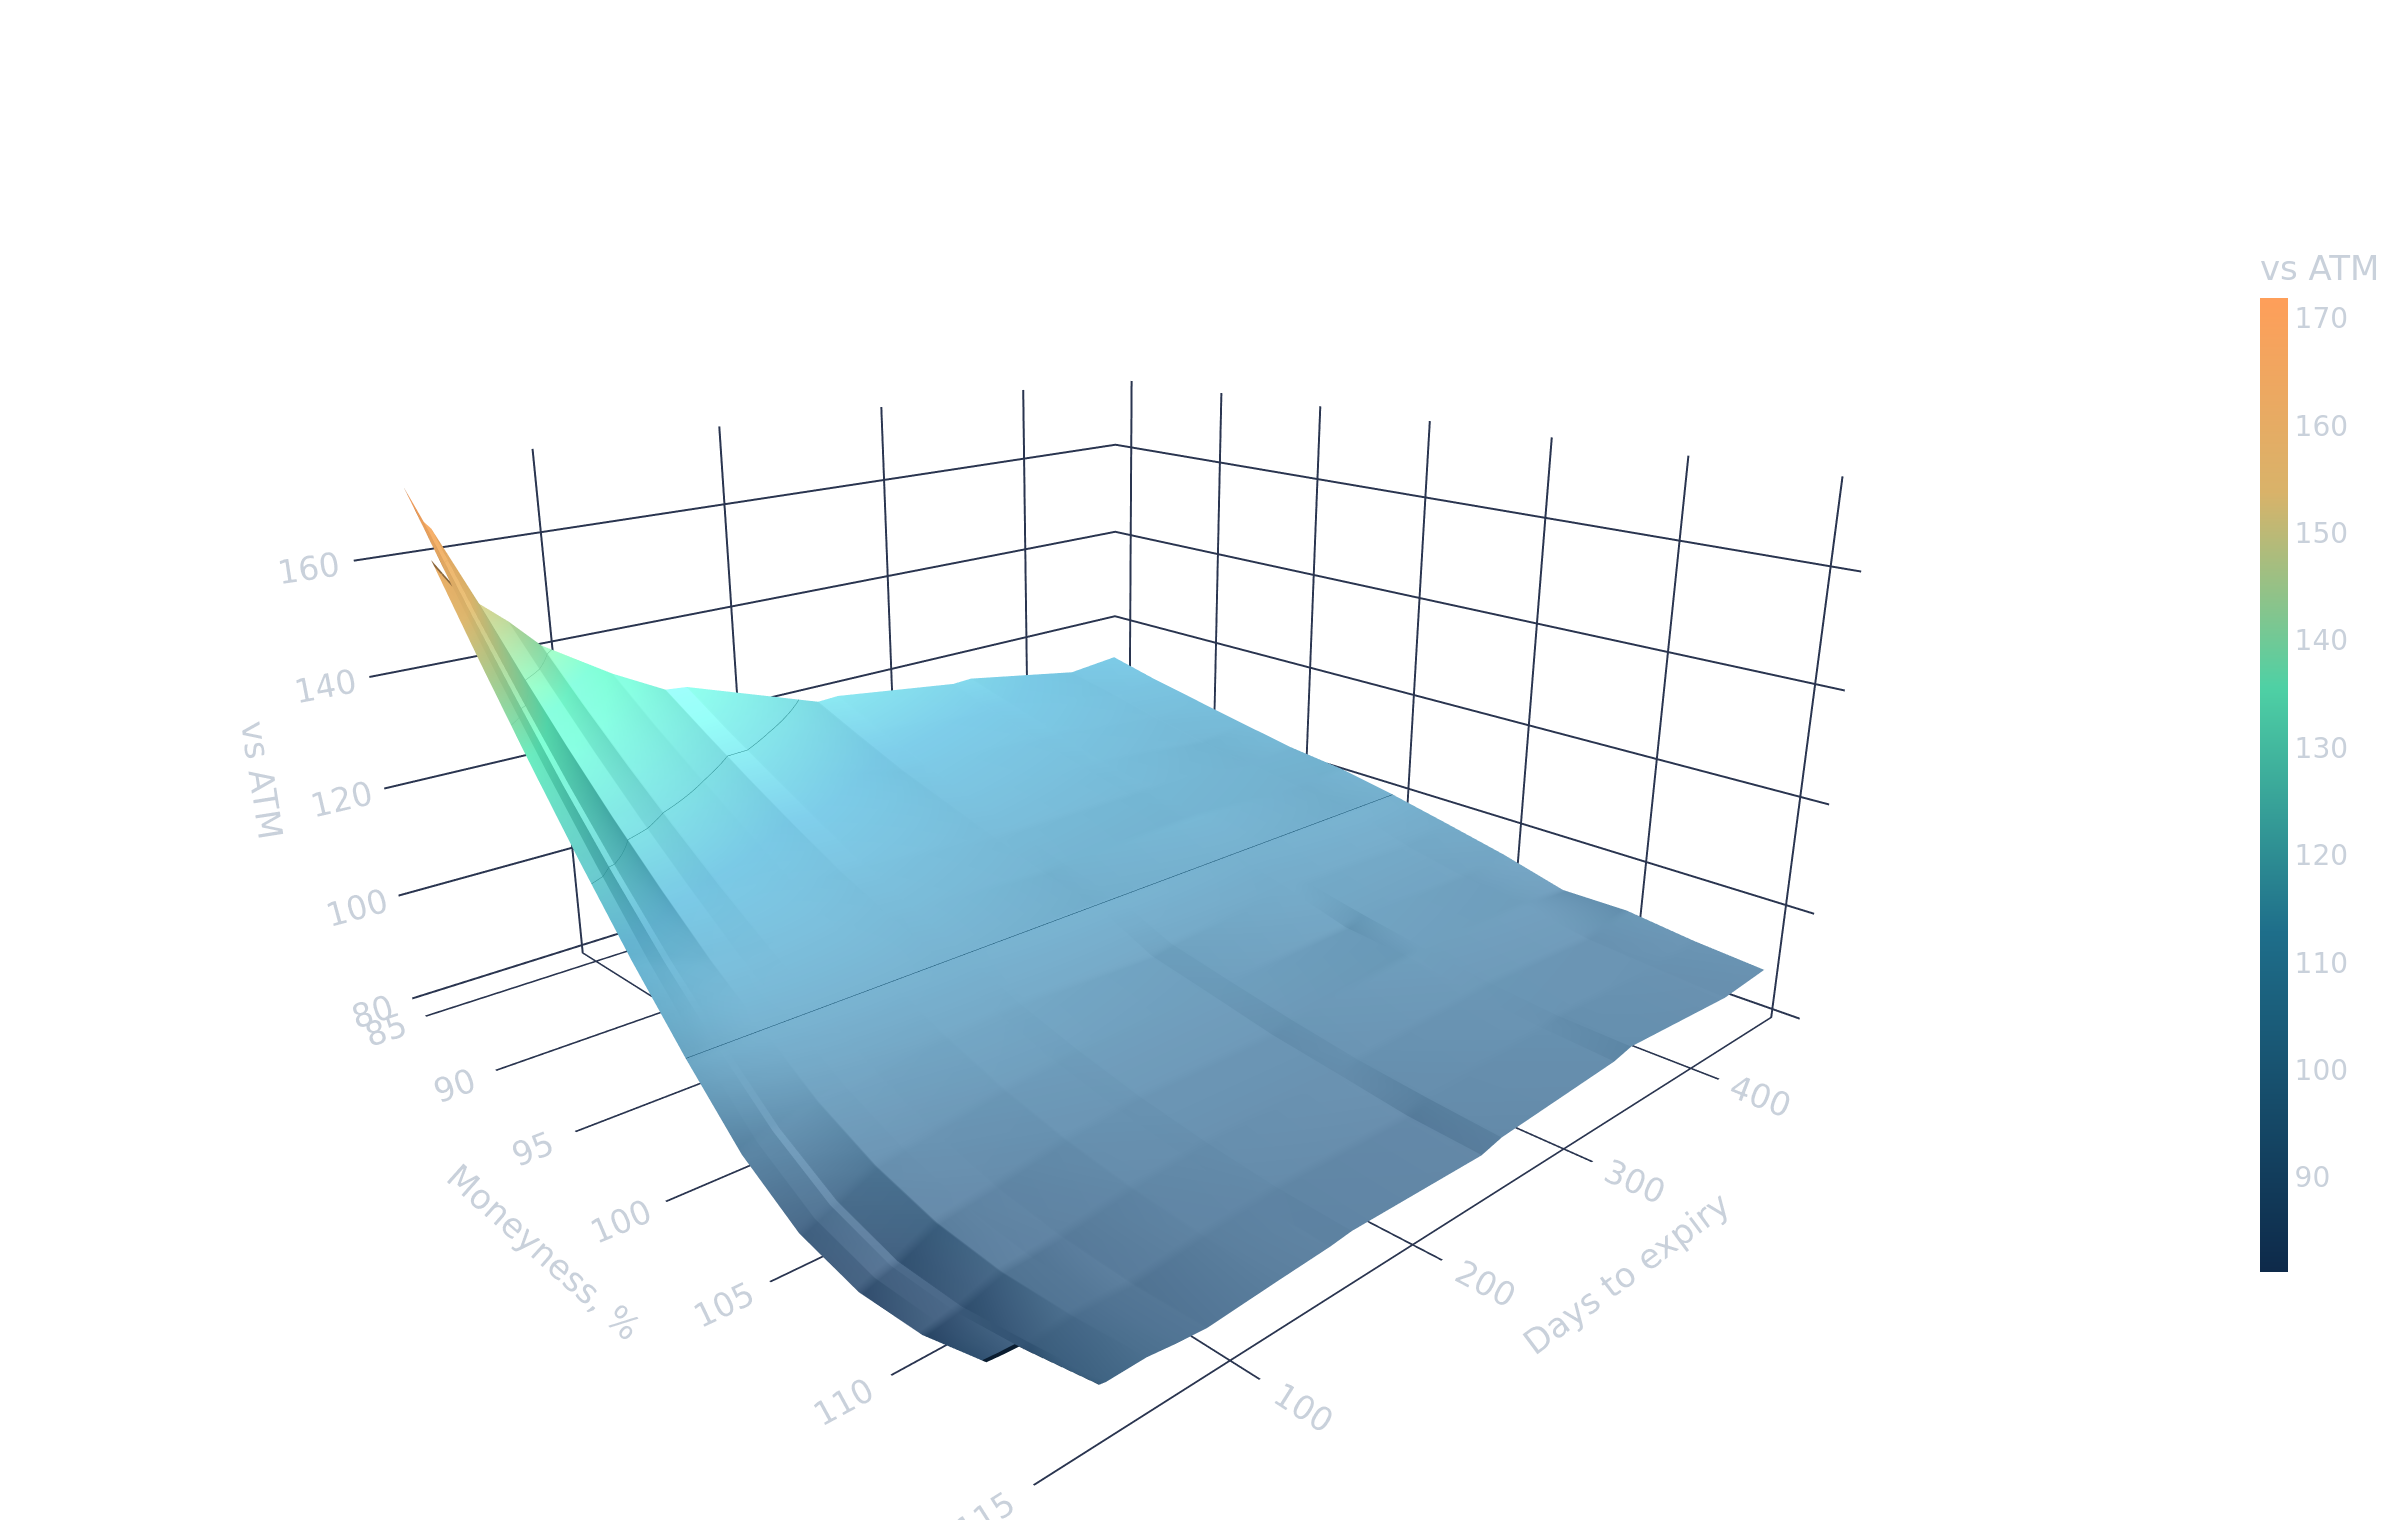
Volatility vs ATM = 100
Implied volatility relative to ATM by moneyness and days to expiry. From 20 days to about 15 months, 85% to 115% moneyness.
Expected move by horizon
ATM IV × √(days/365), each close of the week.
Cboe SKEW · 1 year
Cboe SKEW index over the last year, 5-day average; the dot is the latest close. Higher means downside protection is relatively more expensive. Source: Cboe.
VIX / VIX3M
Last year, 5-day average; the dot is the latest close. Below 0.85 reads Calm, 0.85 to 0.95 Normal, above 0.95 Elevated. Source: Cboe.
Source: own calculations. Session of 16 Oct 2026, published Mon 19 Oct after 9:30 a.m. New York time. Expected move KPI to nearest expiry (Friday weekly) = ATM straddle ÷ spot × 100%; horizon chart = ATM IV (%) × √(days/365); skew index = 30D put−call skew ÷ ATM vol × 100. Surface and smile relative to ATM = 100. Not investment advice.